Aggregated Leaderboard Metrics Expose Winning Loadout Patterns in Squad-Based Shooters
Ben Klein · Jul 11, 2026
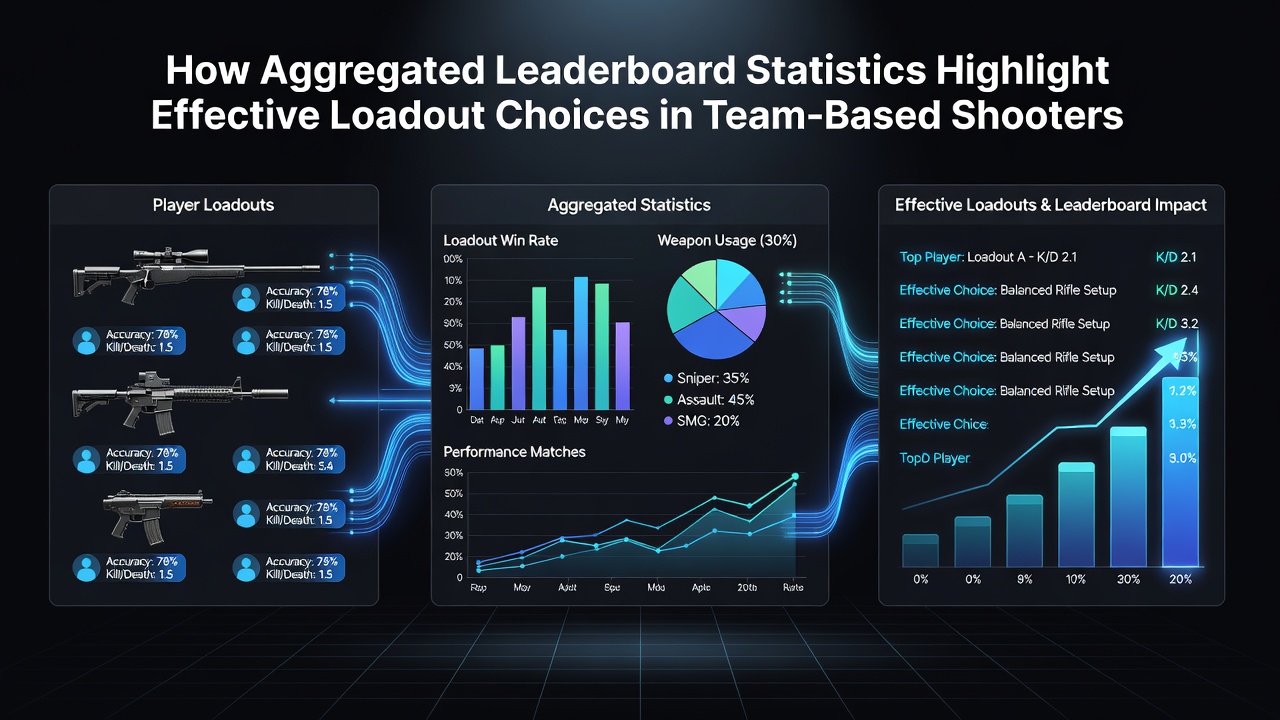
Aggregated Leaderboard Metrics Expose Winning Loadout Patterns in Squad-Based Shooters
Team-based shooters generate enormous volumes of match data each day, and platforms that aggregate leaderboard statistics turn those raw numbers into clear signals about which loadouts deliver consistent results across thousands of games. Researchers who analyze these datasets notice strong correlations between specific weapon combinations, attachment choices, and team victory rates, especially when the information spans multiple ranks and regions. As of July 2026, several major titles continue to release updated leaderboards that feed directly into public analytics tools, allowing observers to track how balance patches shift optimal selections over time.
Core Metrics That Shape Loadout Analysis
Win rate, average damage per round, and objective completion percentages form the foundation of most aggregated systems, yet kill-death ratios alone rarely tell the full story in squad play. Data from large-scale collections shows that weapons with moderate individual damage output often pair with higher win percentages when teammates coordinate utility usage effectively. Those who've examined millions of matches across different titles find that mobility-focused loadouts tend to boost success rates in fast-paced objective modes, whereas stationary defensive setups perform better in prolonged defensive scenarios.
Regional and Rank-Based Variations
Leaderboard aggregation reveals noticeable differences between regions and skill brackets, and analysts at institutions such as the University of Sydney have documented how Australian players favor certain submachine gun builds that emphasize close-quarters movement speed. In contrast, North American data frequently highlights assault rifle variants with extended range attachments that support mid-map control. Lower-ranked brackets often show higher variance in loadout performance, while top-tier players converge on narrower sets of choices that emphasize consistency over experimentation.
One study of aggregated European server data indicated that players who equip flashbang-heavy utility kits achieved measurable improvements in team objective wins, particularly when paired with suppressed secondary weapons for information gathering. These patterns emerge only after filtering out thousands of individual matches and normalizing for variables such as map rotation and patch version.
Practical Examples from Major Titles
Valorant and Counter-Strike 2 leaderboards provide especially rich datasets because each round produces discrete performance markers that aggregate cleanly. Observers tracking July 2026 season data note that certain rifle-and-smoke combinations maintain above-average win rates even after multiple balance adjustments, suggesting the statistics capture genuine strategic advantages rather than temporary meta trends. In Overwatch 2 team compositions, aggregated support loadouts that prioritize healing throughput over damage amplification frequently correlate with higher team survival metrics across professional and amateur brackets alike.
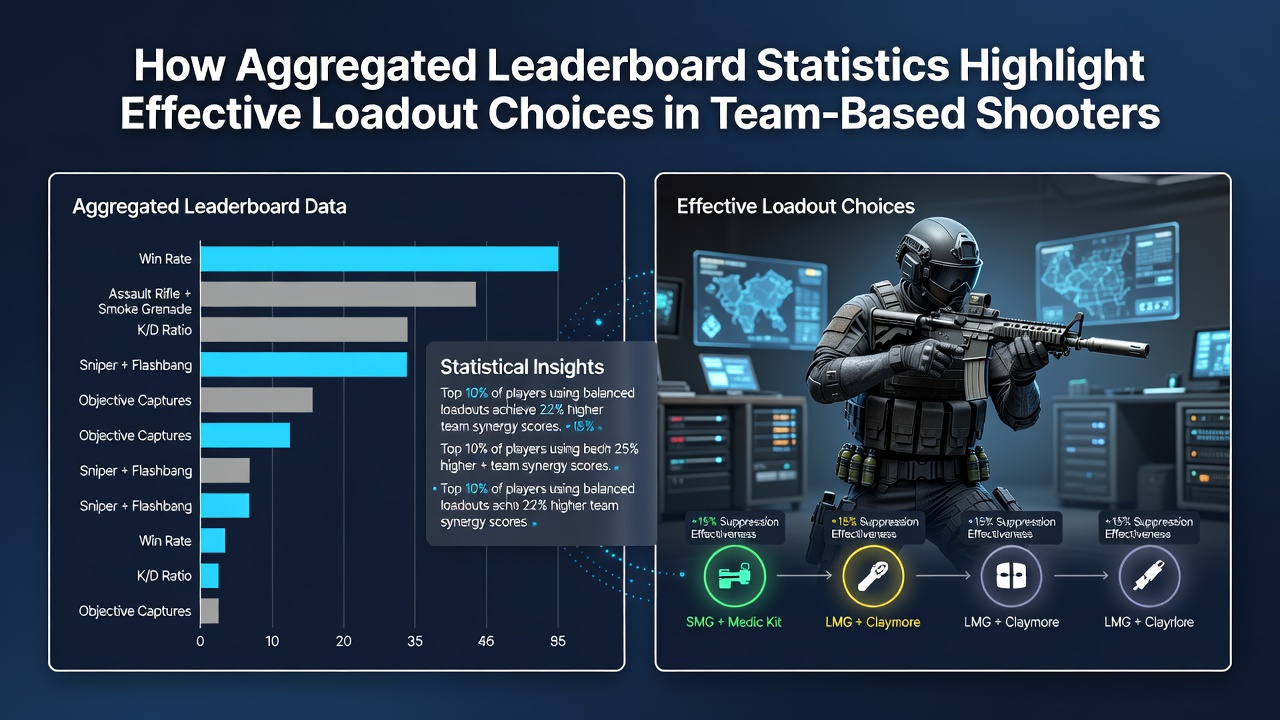
Battlefield series data further illustrates how vehicle and gadget pairings influence larger-scale outcomes, with aggregated reports showing that anti-vehicle loadouts paired with repair tools sustain longer match contributions than pure damage builds. Players reviewing these statistics often discover that hybrid selections outperform specialized ones when matches extend beyond standard time limits, a finding confirmed across multiple continents through shared public datasets.
Limitations and Interpretation Challenges
Aggregated statistics provide powerful signals yet carry inherent constraints because they reflect population averages rather than individual skill ceilings. Research groups note that small sample sizes in niche loadout categories can produce misleading spikes, and platform algorithms sometimes weight recent matches more heavily than historical performance. Those studying the data emphasize cross-referencing multiple sources before drawing firm conclusions about any single configuration.
Industry reports from the Entertainment Software Association highlight ongoing efforts to improve data transparency, which in turn helps both developers and players understand how loadout choices interact with matchmaking systems. The result is a feedback loop where public leaderboards influence community experimentation and subsequent patches refine the underlying mechanics.
Conclusion
Aggregated leaderboard statistics continue to serve as a reliable lens for identifying effective loadout patterns in team-based shooters, provided users account for sample size, regional differences, and evolving game updates. As platforms refine their collection methods through 2026 and beyond, the precision of these insights is expected to increase, giving both casual participants and competitive teams clearer guidance on equipment selections that align with team objectives.